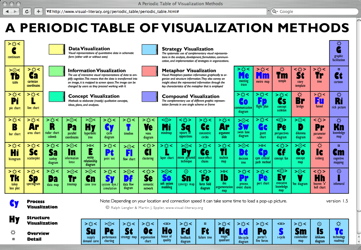
“If you’ve ever wondered how to model something, or were looking for new ideas for segmenting and presenting complex concepts, this is an incredible online resource. A neat graphical explanation and example of each “element” (ex; a cycle diagram) appears as soon as your cursor scrolls over them…”
It’s really functional…keeping producing such visualization charts.
http://www.gadgetsblog.org/
Apr 29th, 2007 / 8:32 am