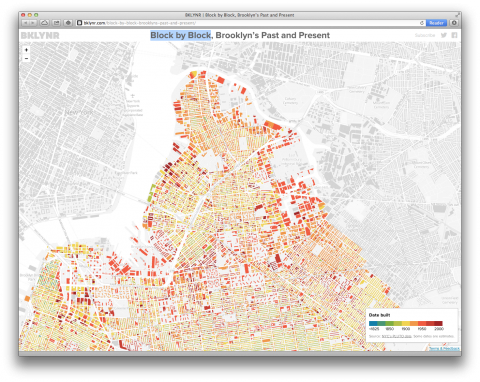
Thomas Rhiel created this stunning, colorful map of all of Brooklyn’s 320,000+ buildings. He plotted and shaded each of them according to its year of construction. The result is a snapshot of Brooklyn’s evolution, revealing how development has rippled across certain neighborhoods while leaving some pockets unchanged for decades, even centuries.
shame it isn’t a overlay so you can flip to street view or photos.
Aug 5th, 2013 / 7:05 am
See also Portland: http://labratrevenge.com/pdx/#13/45.5059/-122.5906
Aug 5th, 2013 / 3:05 pm
this is a map is built on a recently liberated dataset. if you are interested in understanding the dataset that powers this map, join us at BetaNYC. .
Aug 5th, 2013 / 4:05 pm
Fantastic project, you have to admire Thomas Rhiel’s tenacity!
Aug 6th, 2013 / 5:06 am